Results
Five controlled experiments. All train four depth variants (L3, L6, L9, L12) identically on
500K MS MARCO triples and evaluate zero-shot on the full BEIR corpora (nfcorpus, scifact,
fiqa). See report.md for analysis.
| Experiment | Batch | Steps | Seed | Purpose |
|---|---|---|---|---|
| A | 256 | 20,000 | 42 | Large-batch baseline |
| B | 32 | 20,000 | 42 | Standard batch-32 run |
| C | 32 | 20,000 | 43 | Seed variance |
| D | 32 | 20,000 | 44 | Seed variance |
| E | 32 | 80,000 | 42 | Training saturation (4× B) |
Latency reporting. Of five profiling runs, two (B and E) produced the same physically coherent p50 ladder (
p50 ≈ 12.3 + 0.33 × n_layers). The other three (A, C, D) produced anomalously fast and non-monotone ladders whose root cause was not isolated (likely candidates: CUDA kernel cache state, torch autotuner decisions, Python timing noise at sub-10-ms encodes). We treat the B/E ladder as canonical throughout; all five runs are reported in full below for transparency.
Shared setup
| Field | Value |
|---|---|
| Base checkpoint | bert-base-uncased |
| Training data | 500,000 MS MARCO text triples (seed determines the sample) |
| Loss | MultipleNegativesRankingLoss (in-batch negatives) |
| Optimizer | AdamW, lr=2e-5, weight decay=0.01 |
| Schedule | Linear warmup 10%, linear decay |
| Query / passage max length | 32 / 128 tokens |
| Precision | bf16 (training); fp16 (eval + latency) |
| Depth ablation | Drop top-N encoder layers: encoder.layer[:N] |
| Eval benchmarks | BEIR: nfcorpus, scifact, fiqa (full corpora) |
| Latency | batch=1, seq=128, fp16, 50 warmup + 500 measured, cuda:0 |
| Hardware | Azure Linux VM, H100 GPU |
Mean NDCG@10 across BEIR — all five runs
| variant | A (b256/20K/s42) | B (b32/20K/s42) | C (b32/20K/s43) | D (b32/20K/s44) | E (b32/80K/s42) |
|---|---|---|---|---|---|
| L12 | 0.2551 | 0.2326 | 0.2410 | 0.2463 | 0.2143 |
| L9 | 0.2655 | 0.2388 | 0.2382 | 0.2384 | 0.2109 |
| L6 | 0.2709 | 0.2427 | 0.2441 | 0.2446 | 0.2254 |
| L3 | 0.2708 | 0.2428 | 0.2427 | 0.2412 | 0.2203 |
Seed-averaged results (b32/20K, seeds 42/43/44)
| variant | mean NDCG@10 | σ (n=3) | mean − 2σ | mean + 2σ |
|---|---|---|---|---|
| L12 | 0.2400 | 0.0069 | 0.2262 | 0.2538 |
| L9 | 0.2385 | 0.0003 | 0.2379 | 0.2391 |
| L6 | 0.2438 | 0.0010 | 0.2418 | 0.2458 |
| L3 | 0.2422 | 0.0009 | 0.2404 | 0.2440 |
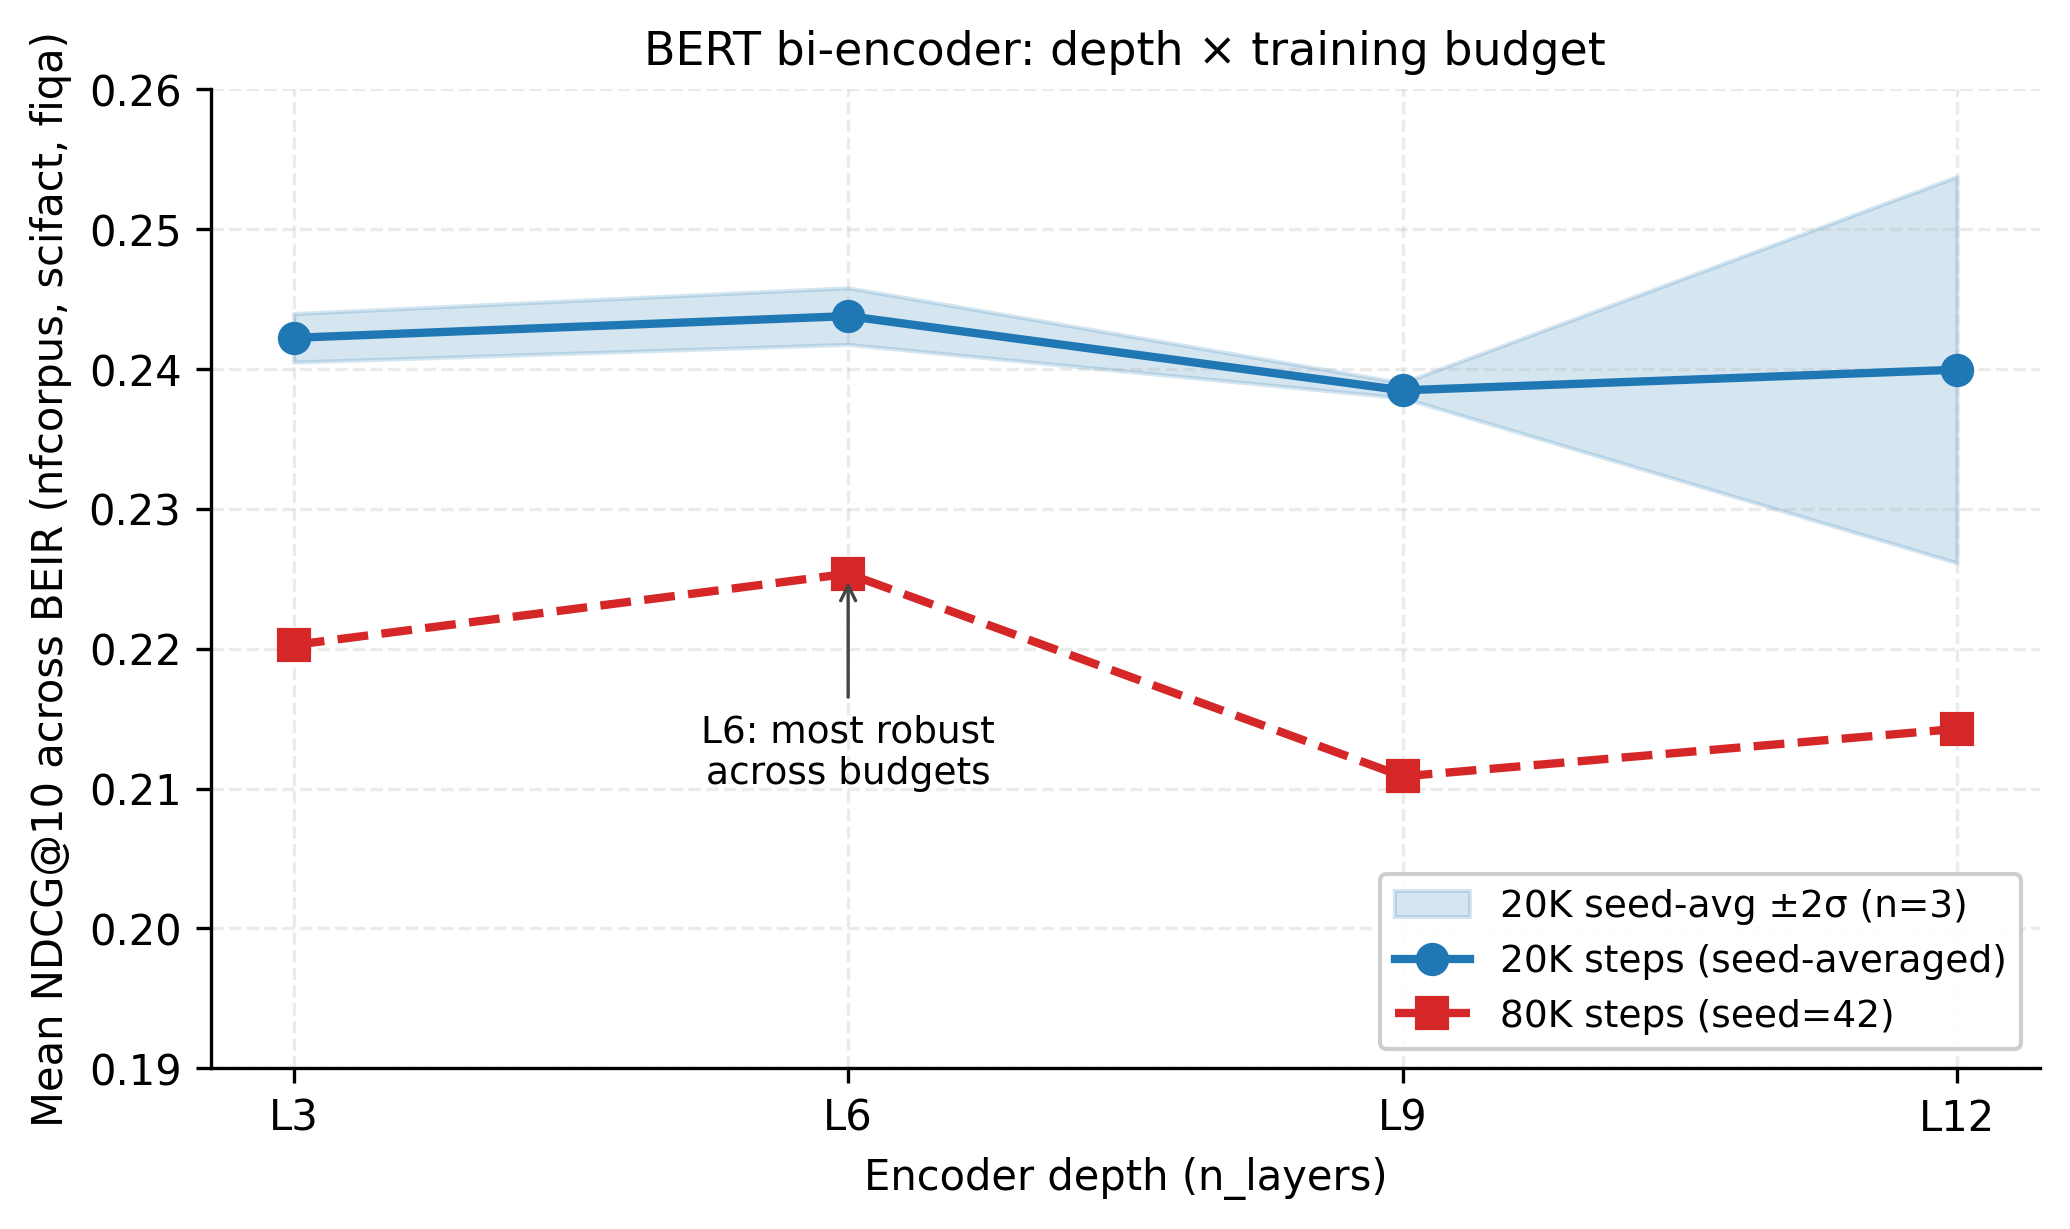
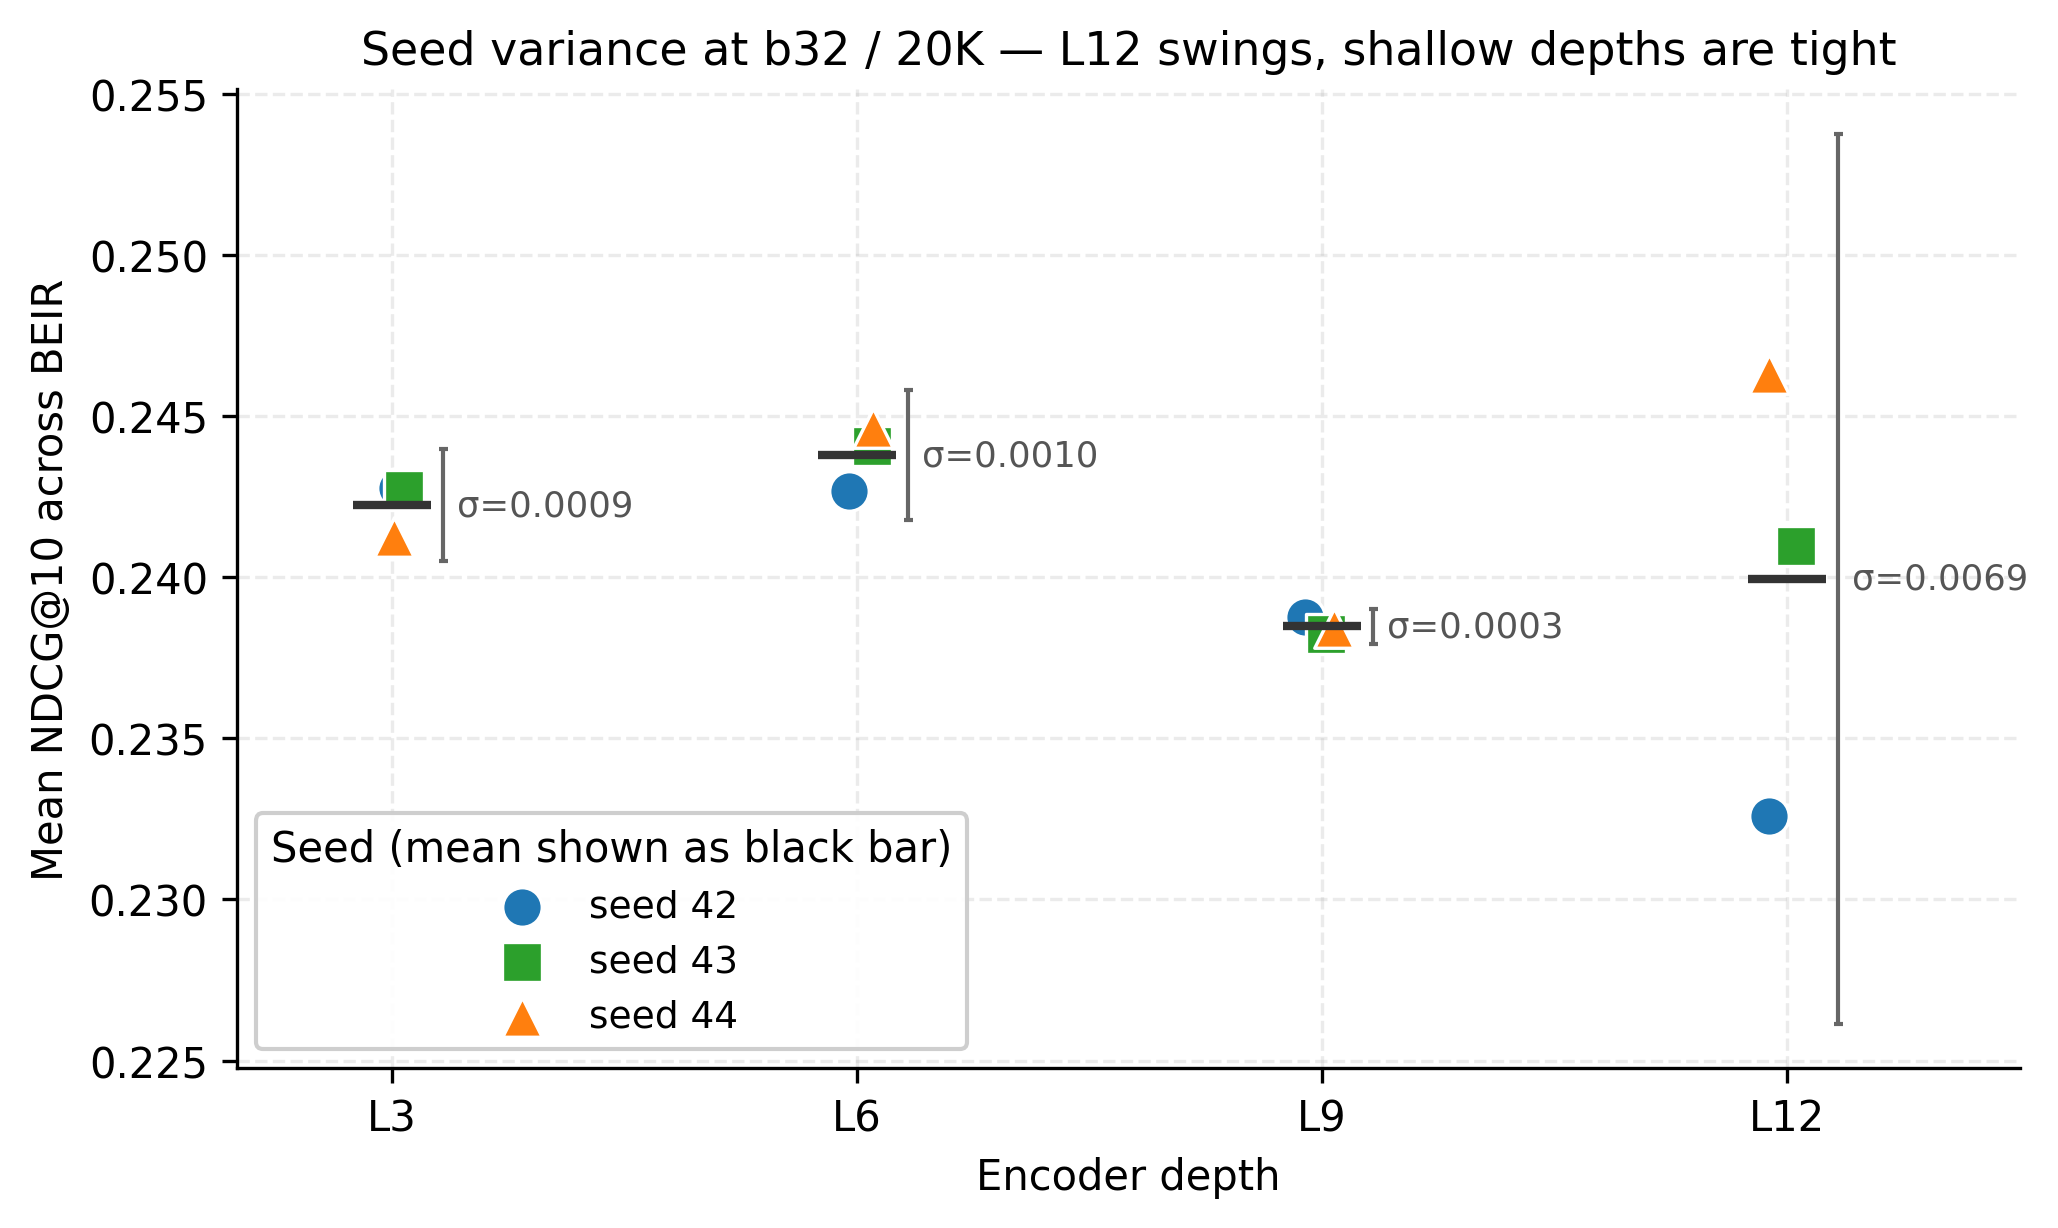
L12’s seed variance is 7–23× larger than the shallow models’ — diagnostic of undertraining at 20K. The previously reported “L6 > L12” gap (+0.0101 on seed 42) is +0.0038 on the 3-seed mean and reverses on seed 44 (L12 > L6 by 0.0017). At 20K, L3/L6/L9/L12 are statistically indistinguishable within seed noise.
Per-seed breakdown (mean NDCG@10 across BEIR)
| variant | seed 42 | seed 43 | seed 44 |
|---|---|---|---|
| L12 | 0.2326 | 0.2410 | 0.2463 |
| L9 | 0.2388 | 0.2382 | 0.2384 |
| L6 | 0.2427 | 0.2441 | 0.2446 |
| L3 | 0.2428 | 0.2427 | 0.2412 |
Per-seed L6 − L12 gap
| seed | L6 − L12 |
|---|---|
| 42 | +0.0101 |
| 43 | +0.0031 |
| 44 | −0.0017 |
| mean | +0.0038 |
Training saturation (Experiment B vs E, same seed, 4× steps)
Mean NDCG@10
| variant | B: 20K | E: 80K | Δ | % change |
|---|---|---|---|---|
| L12 | 0.2326 | 0.2143 | −0.0183 | −7.9% |
| L9 | 0.2388 | 0.2109 | −0.0279 | −11.7% |
| L6 | 0.2427 | 0.2254 | −0.0173 | −7.1% |
| L3 | 0.2428 | 0.2203 | −0.0225 | −9.3% |
Per-benchmark breakdown: where did the degradation land?
| variant | nfcorpus 20K → 80K | scifact 20K → 80K | fiqa 20K → 80K |
|---|---|---|---|
| L12 | 0.2195 → 0.2186 (−0.4%) | 0.3644 → 0.3617 (−0.7%) | 0.1139 → 0.0625 (−45.1%) |
| L9 | 0.2295 → 0.2111 (−8.0%) | 0.3777 → 0.3530 (−6.5%) | 0.1091 → 0.0685 (−37.2%) |
| L6 | 0.2140 → 0.2154 (+0.7%) | 0.4048 → 0.3815 (−5.8%) | 0.1092 → 0.0792 (−27.5%) |
| L3 | 0.2177 → 0.2185 (+0.4%) | 0.3961 → 0.3593 (−9.3%) | 0.1145 → 0.0830 (−27.5%) |
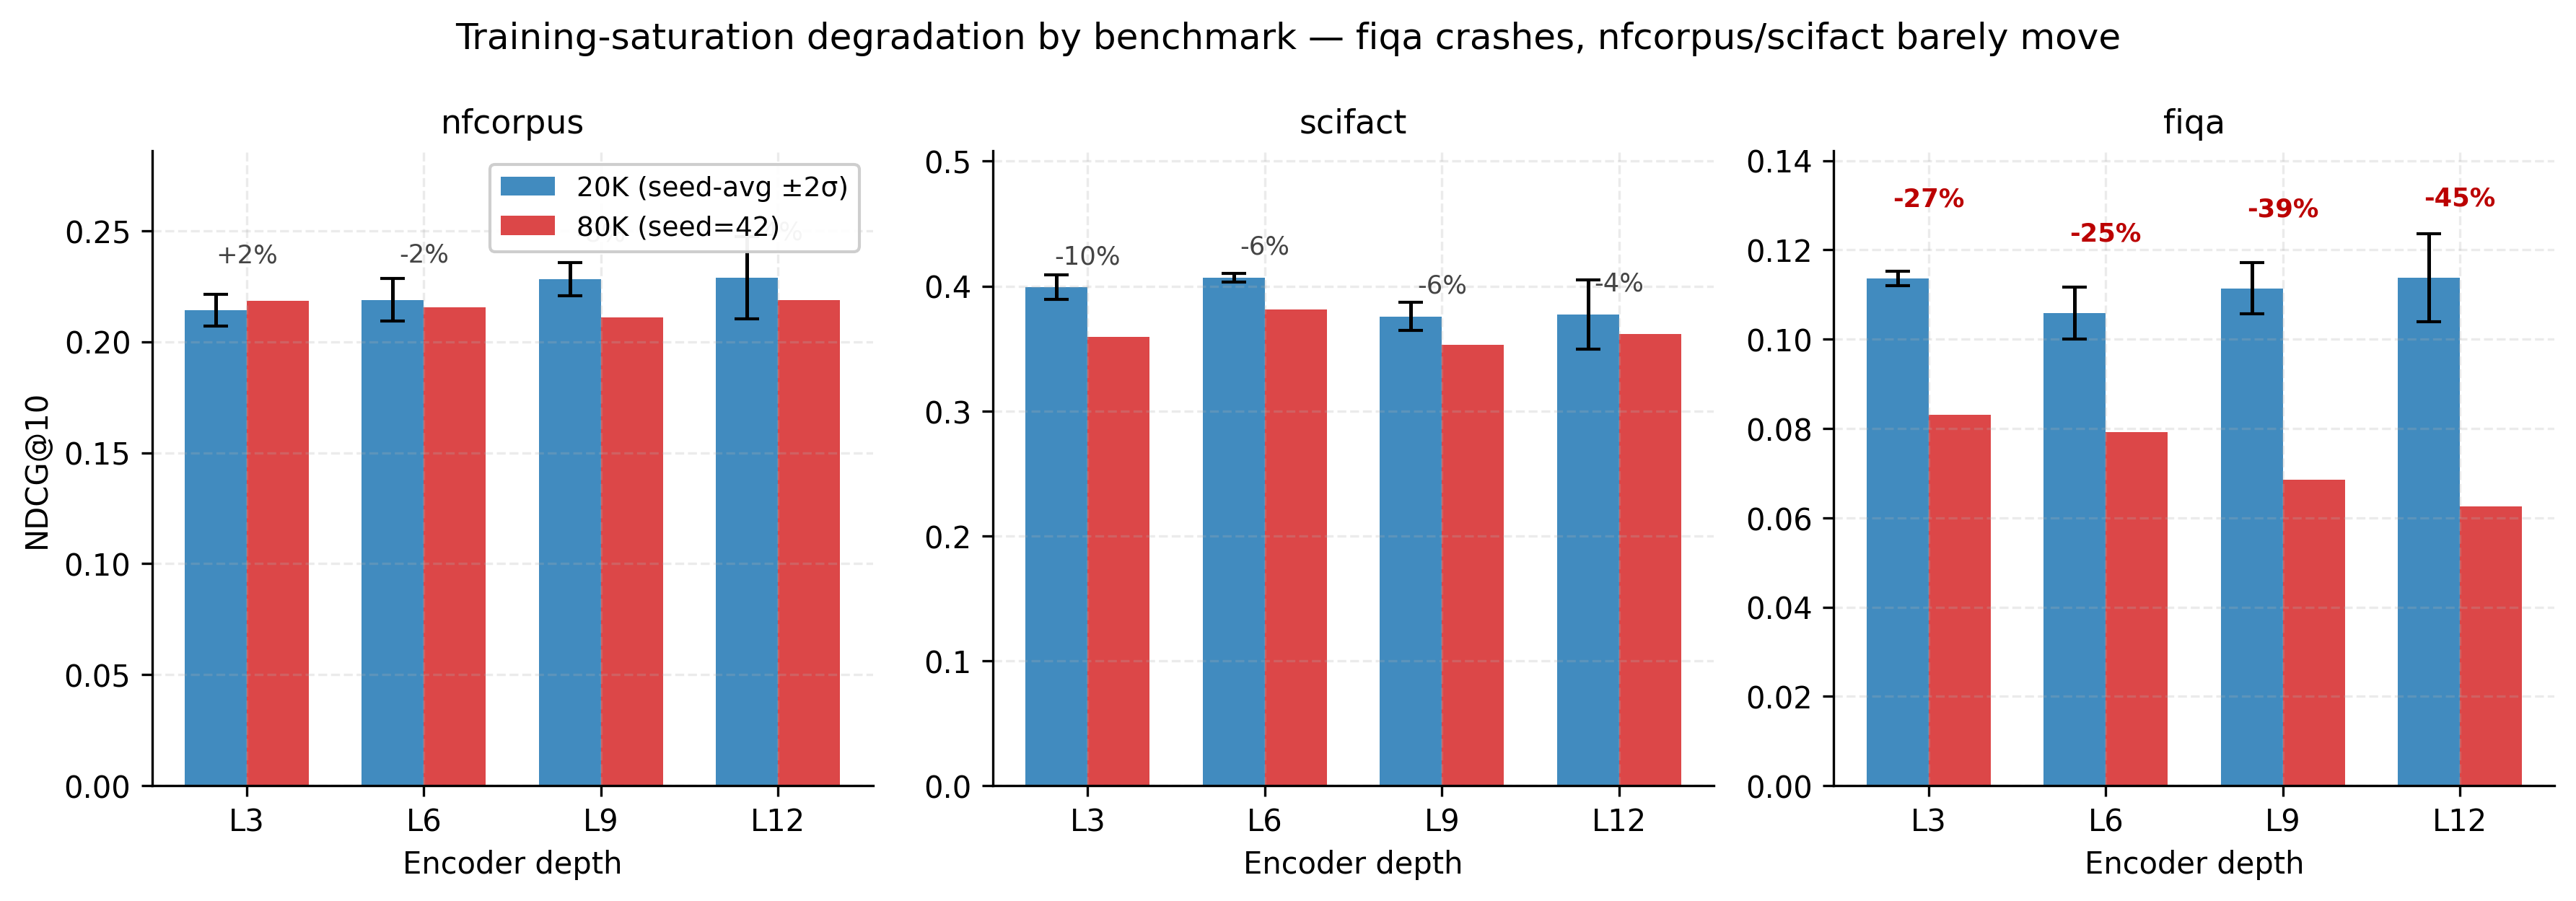
The degradation is not uniform. nfcorpus is essentially unchanged. scifact drops 5–9% across depths. fiqa crashes 27–45%, with deeper models losing more. This is consistent with single-source overfitting to MS MARCO’s distribution (DRAGON-style), with deeper models overfitting harder.
Full per-benchmark metrics
Experiment A — batch=256, 20K steps, seed=42
| variant | n_layers | benchmark | NDCG@10 | MRR@10 | Recall@10 | Recall@100 |
|---|---|---|---|---|---|---|
| L12 | 12 | nfcorpus | 0.2437 | 0.4355 | 0.1109 | 0.2324 |
| L12 | 12 | scifact | 0.4127 | 0.3935 | 0.5088 | 0.7386 |
| L12 | 12 | fiqa | 0.1089 | 0.1333 | 0.1450 | 0.3487 |
| L9 | 9 | nfcorpus | 0.2433 | 0.4292 | 0.1090 | 0.2360 |
| L9 | 9 | scifact | 0.4325 | 0.4060 | 0.5483 | 0.7514 |
| L9 | 9 | fiqa | 0.1206 | 0.1553 | 0.1596 | 0.3653 |
| L6 | 6 | nfcorpus | 0.2483 | 0.4427 | 0.1126 | 0.2390 |
| L6 | 6 | scifact | 0.4437 | 0.4160 | 0.5694 | 0.7592 |
| L6 | 6 | fiqa | 0.1207 | 0.1621 | 0.1554 | 0.3526 |
| L3 | 3 | nfcorpus | 0.2466 | 0.4373 | 0.1131 | 0.2348 |
| L3 | 3 | scifact | 0.4415 | 0.4137 | 0.5614 | 0.7649 |
| L3 | 3 | fiqa | 0.1243 | 0.1510 | 0.1678 | 0.3423 |
Experiment B — batch=32, 20K steps, seed=42
| variant | n_layers | benchmark | NDCG@10 | MRR@10 | Recall@10 | Recall@100 |
|---|---|---|---|---|---|---|
| L12 | 12 | nfcorpus | 0.2195 | 0.4079 | 0.0957 | 0.2193 |
| L12 | 12 | scifact | 0.3644 | 0.3287 | 0.5049 | 0.7292 |
| L12 | 12 | fiqa | 0.1139 | 0.1429 | 0.1498 | 0.3516 |
| L9 | 9 | nfcorpus | 0.2295 | 0.4186 | 0.1055 | 0.2224 |
| L9 | 9 | scifact | 0.3777 | 0.3495 | 0.4921 | 0.7244 |
| L9 | 9 | fiqa | 0.1091 | 0.1365 | 0.1462 | 0.3469 |
| L6 | 6 | nfcorpus | 0.2140 | 0.4158 | 0.0962 | 0.2235 |
| L6 | 6 | scifact | 0.4048 | 0.3713 | 0.5414 | 0.7491 |
| L6 | 6 | fiqa | 0.1092 | 0.1416 | 0.1392 | 0.3504 |
| L3 | 3 | nfcorpus | 0.2177 | 0.4042 | 0.1006 | 0.2210 |
| L3 | 3 | scifact | 0.3961 | 0.3620 | 0.5290 | 0.7257 |
| L3 | 3 | fiqa | 0.1145 | 0.1444 | 0.1455 | 0.3247 |
Experiment C — batch=32, 20K steps, seed=43
| variant | n_layers | benchmark | NDCG@10 | MRR@10 | Recall@10 | Recall@100 |
|---|---|---|---|---|---|---|
| L12 | 12 | nfcorpus | 0.2288 | 0.4056 | 0.1069 | 0.2157 |
| L12 | 12 | scifact | 0.3755 | 0.3474 | 0.4944 | 0.7164 |
| L12 | 12 | fiqa | 0.1186 | 0.1441 | 0.1587 | 0.3502 |
| L9 | 9 | nfcorpus | 0.2241 | 0.4156 | 0.0982 | 0.2179 |
| L9 | 9 | scifact | 0.3801 | 0.3533 | 0.4995 | 0.7609 |
| L9 | 9 | fiqa | 0.1105 | 0.1378 | 0.1467 | 0.3586 |
| L6 | 6 | nfcorpus | 0.2190 | 0.4252 | 0.1001 | 0.2202 |
| L6 | 6 | scifact | 0.4085 | 0.3881 | 0.5128 | 0.7408 |
| L6 | 6 | fiqa | 0.1047 | 0.1367 | 0.1384 | 0.3359 |
| L3 | 3 | nfcorpus | 0.2106 | 0.3935 | 0.0977 | 0.2160 |
| L3 | 3 | scifact | 0.4046 | 0.3713 | 0.5416 | 0.7237 |
| L3 | 3 | fiqa | 0.1129 | 0.1416 | 0.1522 | 0.3210 |
Experiment D — batch=32, 20K steps, seed=44
| variant | n_layers | benchmark | NDCG@10 | MRR@10 | Recall@10 | Recall@100 |
|---|---|---|---|---|---|---|
| L12 | 12 | nfcorpus | 0.2381 | 0.4192 | 0.1074 | 0.2217 |
| L12 | 12 | scifact | 0.3920 | 0.3627 | 0.5164 | 0.7502 |
| L12 | 12 | fiqa | 0.1088 | 0.1366 | 0.1481 | 0.3569 |
| L9 | 9 | nfcorpus | 0.2313 | 0.4244 | 0.1037 | 0.2246 |
| L9 | 9 | scifact | 0.3694 | 0.3389 | 0.4913 | 0.7464 |
| L9 | 9 | fiqa | 0.1146 | 0.1422 | 0.1550 | 0.3444 |
| L6 | 6 | nfcorpus | 0.2235 | 0.4231 | 0.1036 | 0.2262 |
| L6 | 6 | scifact | 0.4067 | 0.3826 | 0.5167 | 0.7418 |
| L6 | 6 | fiqa | 0.1037 | 0.1320 | 0.1315 | 0.3376 |
| L3 | 3 | nfcorpus | 0.2141 | 0.3940 | 0.1005 | 0.2140 |
| L3 | 3 | scifact | 0.3961 | 0.3634 | 0.5244 | 0.7120 |
| L3 | 3 | fiqa | 0.1135 | 0.1426 | 0.1500 | 0.3315 |
Experiment E — batch=32, 80K steps, seed=42
| variant | n_layers | benchmark | NDCG@10 | MRR@10 | Recall@10 | Recall@100 |
|---|---|---|---|---|---|---|
| L12 | 12 | nfcorpus | 0.2186 | 0.3946 | 0.0987 | 0.2102 |
| L12 | 12 | scifact | 0.3617 | 0.3452 | 0.4499 | 0.6861 |
| L12 | 12 | fiqa | 0.0625 | 0.0817 | 0.0822 | 0.2511 |
| L9 | 9 | nfcorpus | 0.2111 | 0.3894 | 0.0985 | 0.2134 |
| L9 | 9 | scifact | 0.3530 | 0.3337 | 0.4631 | 0.7007 |
| L9 | 9 | fiqa | 0.0685 | 0.0848 | 0.0944 | 0.2622 |
| L6 | 6 | nfcorpus | 0.2154 | 0.3920 | 0.0983 | 0.2294 |
| L6 | 6 | scifact | 0.3815 | 0.3575 | 0.4937 | 0.6969 |
| L6 | 6 | fiqa | 0.0792 | 0.1096 | 0.0981 | 0.2601 |
| L3 | 3 | nfcorpus | 0.2185 | 0.4141 | 0.0988 | 0.2125 |
| L3 | 3 | scifact | 0.3593 | 0.3362 | 0.4723 | 0.7019 |
| L3 | 3 | fiqa | 0.0830 | 0.0993 | 0.1161 | 0.2741 |
Latency — all five profiling runs
Canonical (B and E, identical to the decimal) in bold.
| variant | B: b32/20K/s42 (p50) | E: b32/80K/s42 (p50) | A: b256/s42 (p50) | C: b32/s43 (p50) | D: b32/s44 (p50) |
|---|---|---|---|---|---|
| L12 | 16.17 | 16.21 | 16.16 | 9.41 | 7.06 |
| L9 | 15.78 | 15.78 | 5.68 | 7.71 | 5.59 |
| L6 | 13.03 | 13.01 | 4.21 | 6.55 | 4.15 |
| L3 | 12.65 | 12.64 | 2.69 | 4.78 | 2.63 |
Full tables with p95 and mean below.
Canonical run: b32/20K/seed=42 (Experiment B)
| variant | n_layers | p50 (ms) | p95 (ms) | mean (ms) | n |
|---|---|---|---|---|---|
| L12 | 12 | 16.17 | 320.08 | 52.63 | 500 |
| L9 | 9 | 15.78 | 316.71 | 51.43 | 500 |
| L6 | 6 | 13.03 | 316.26 | 49.34 | 500 |
| L3 | 3 | 12.65 | 315.58 | 48.59 | 500 |
Linear fit: p50 ≈ 12.3 + 0.33 × n_layers. L12/L3 ratio = 1.28×.
Canonical run, replicated: b32/80K/seed=42 (Experiment E)
| variant | n_layers | p50 (ms) | p95 (ms) | mean (ms) | n |
|---|---|---|---|---|---|
| L12 | 12 | 16.21 | 320.72 | 53.70 | 500 |
| L9 | 9 | 15.78 | 318.51 | 53.04 | 500 |
| L6 | 6 | 13.01 | 318.07 | 50.50 | 500 |
| L3 | 3 | 12.64 | 317.37 | 49.89 | 500 |
Reproduces Experiment B’s ladder to the decimal. Architecture-determined latency is confirmed stable across training budgets.
Anomalous run: b256/seed=42 (Experiment A)
| variant | n_layers | p50 (ms) | p95 (ms) | mean (ms) | n |
|---|---|---|---|---|---|
| L12 | 12 | 16.16 | 319.86 | 51.62 | 500 |
| L9 | 9 | 5.68 | 310.96 | 43.51 | 500 |
| L6 | 6 | 4.21 | 311.85 | 42.30 | 500 |
| L3 | 3 | 2.69 | 306.27 | 40.35 | 500 |
L12 matches the canonical ladder; L9/L6/L3 are 2–5× under-reported.
Anomalous run: b32/seed=43 (Experiment C)
| variant | n_layers | p50 (ms) | p95 (ms) | mean (ms) | n |
|---|---|---|---|---|---|
| L12 | 12 | 9.41 | 313.38 | 47.15 | 500 |
| L9 | 9 | 7.71 | 312.44 | 45.58 | 500 |
| L6 | 6 | 6.55 | 310.52 | 44.13 | 500 |
| L3 | 3 | 4.78 | 308.46 | 42.37 | 500 |
All four depths under-reported relative to the canonical ladder.
Anomalous run: b32/seed=44 (Experiment D)
| variant | n_layers | p50 (ms) | p95 (ms) | mean (ms) | n |
|---|---|---|---|---|---|
| L12 | 12 | 7.06 | 310.34 | 44.62 | 500 |
| L9 | 9 | 5.59 | 309.69 | 43.21 | 500 |
| L6 | 6 | 4.15 | 306.50 | 41.63 | 500 |
| L3 | 3 | 2.63 | 305.34 | 40.11 | 500 |
All four depths under-reported; ladder shape roughly matches Experiment A.
The root cause of the bimodal profiling behavior was not isolated. The canonical ladder was reproduced by two independent runs (B and E) and is consistent with a simple per-layer cost model, so we treat it as the architecture-determined truth. Root-causing the profiling instability is listed as an open question in report.md.
Figures
All plots render from the five-experiment results (A/B/C/D/E) on the canonical batch=32 latency ladder; make_plots.py regenerates them from the CSV data.
Depth × training budget. Seed-averaged 20K NDCG@10 (mean across B/C/D) with ±2σ shading, and the single-seed 80K (Experiment E) line overlaid.
Per-benchmark 80K degradation. Change in NDCG@10 from the 20K seed-average to 80K, broken out by benchmark. fiqa is the failure mode; nfcorpus / scifact move within noise.
Seed variance by depth. Per-seed NDCG@10 for each depth at 20K. L12’s spread is an order of magnitude larger than L3/L6/L9, diagnostic of undertraining at deep capacity.
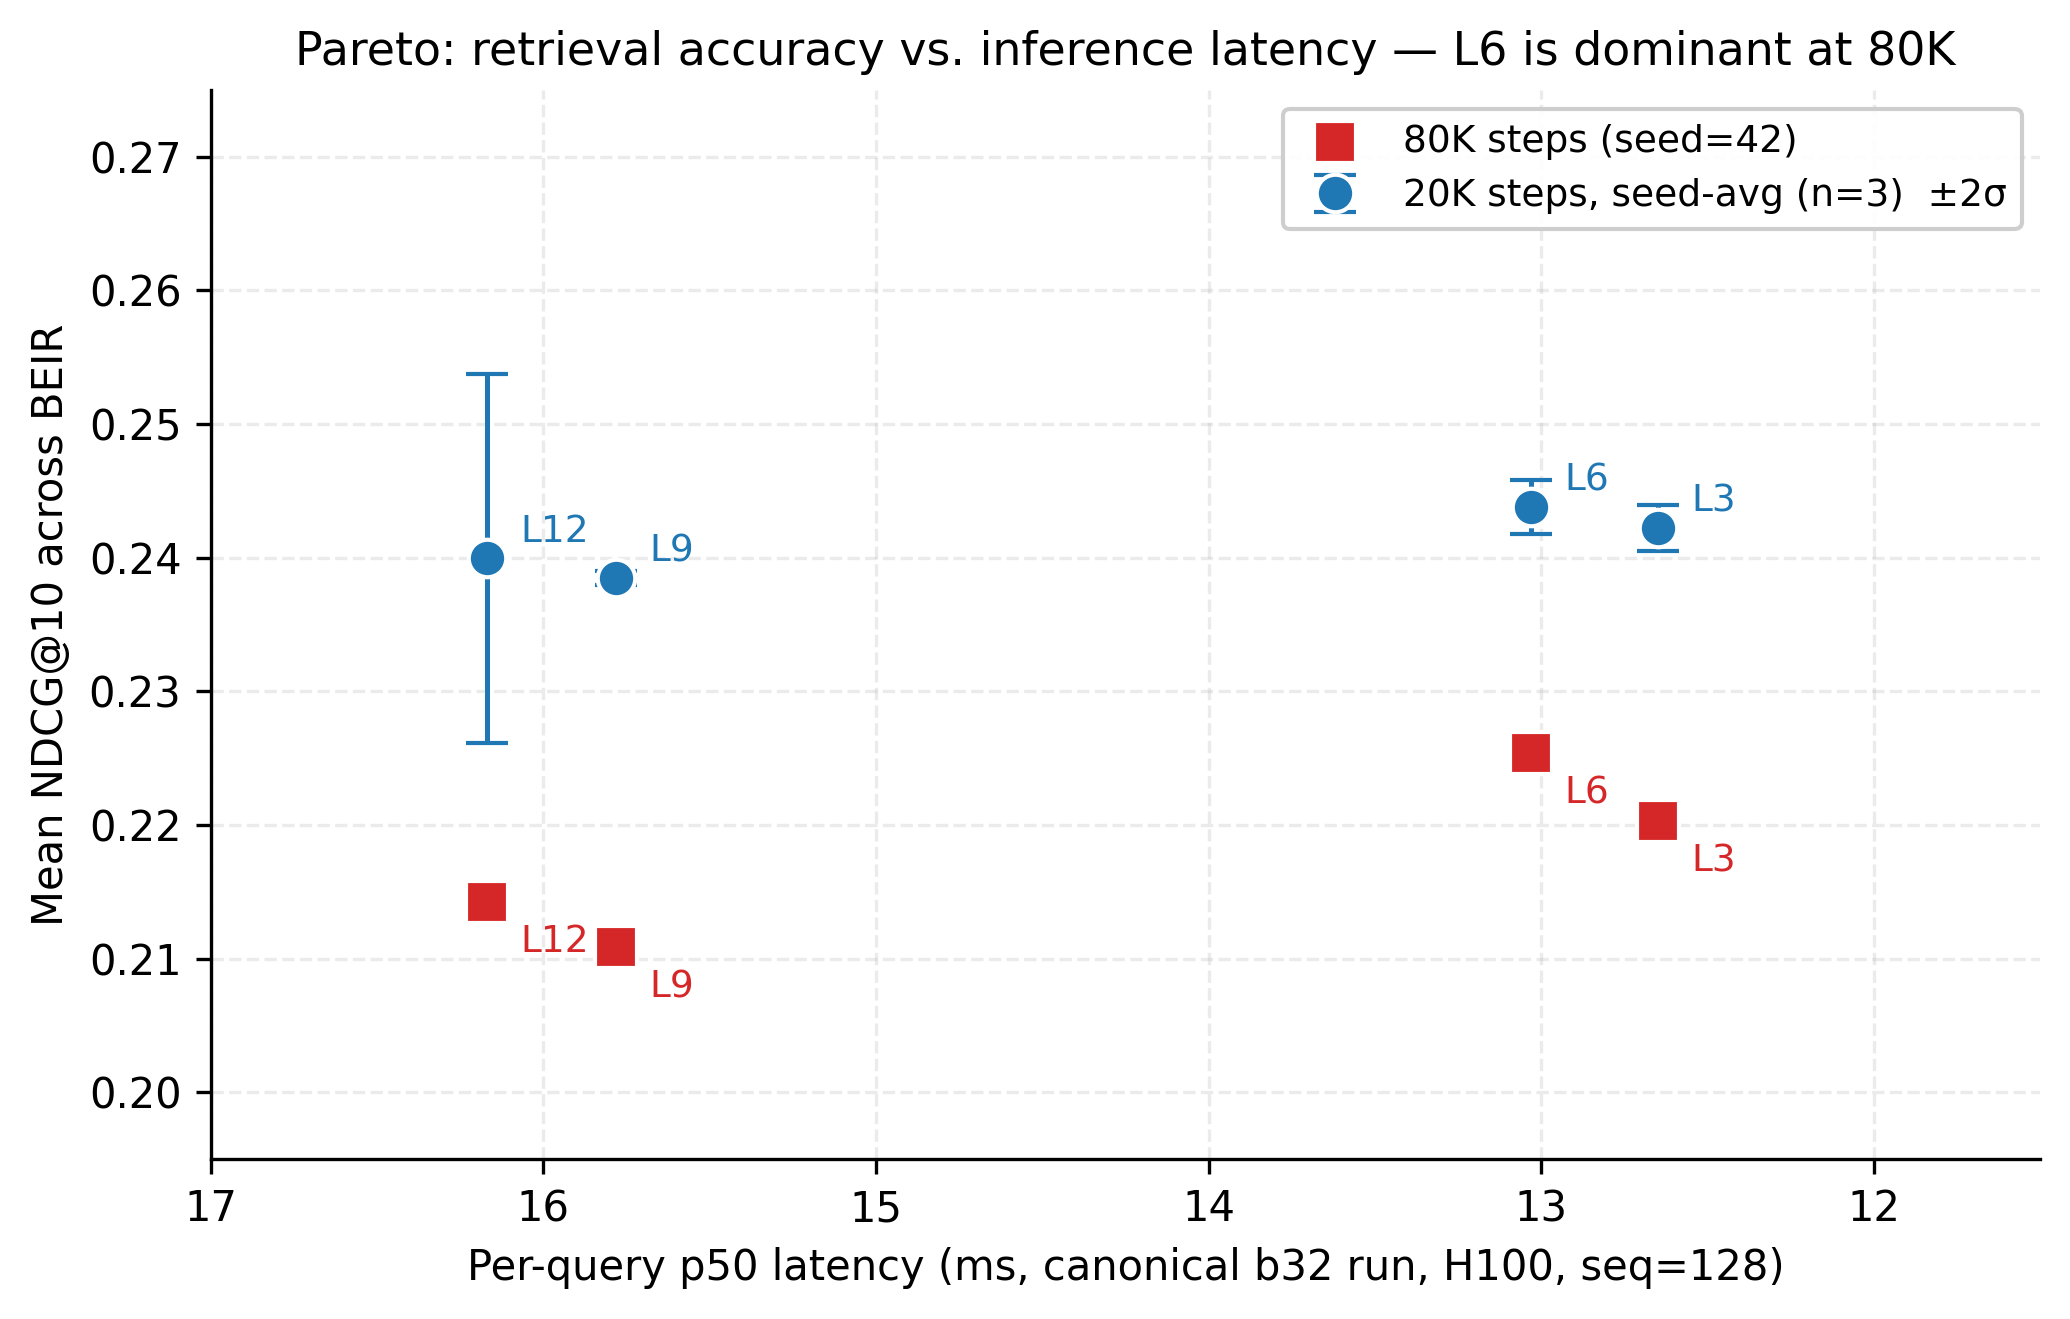
Pareto frontier. Mean NDCG@10 vs. p50 latency, with 20K seed-averaged points and 80K single-seed points. L6 sits on the frontier at both budgets.
Cross-experiment summary
| variant | 20K seed-avg NDCG@10 | ± 2σ | 80K NDCG@10 | Δ (80K − 20K mean) | p50 (canonical) |
|---|---|---|---|---|---|
| L12 | 0.2400 | ±0.0138 | 0.2143 | −0.0257 | 16.17 |
| L9 | 0.2385 | ±0.0006 | 0.2109 | −0.0276 | 15.78 |
| L6 | 0.2438 | ±0.0020 | 0.2254 | −0.0184 | 13.03 |
| L3 | 0.2422 | ±0.0018 | 0.2203 | −0.0219 | 12.65 |
The depth ordering at 20K collapses within seed noise; at 80K, L6 > L3 > L12 > L9, with all variants degrading from their 20K means. L6 is Pareto-dominant across both training budgets: top-2 at 20K, top-1 at 80K, ~20% faster than L12 to serve.